



We grew 0.4%. We sold 1.6% less. The growth slide goes up. Revenue €80.2m, up 0.4%. Someone says “flat but holding.” The room nods. Nobody asks how many boxes we actually shipped.
We shipped 1.6% fewer.
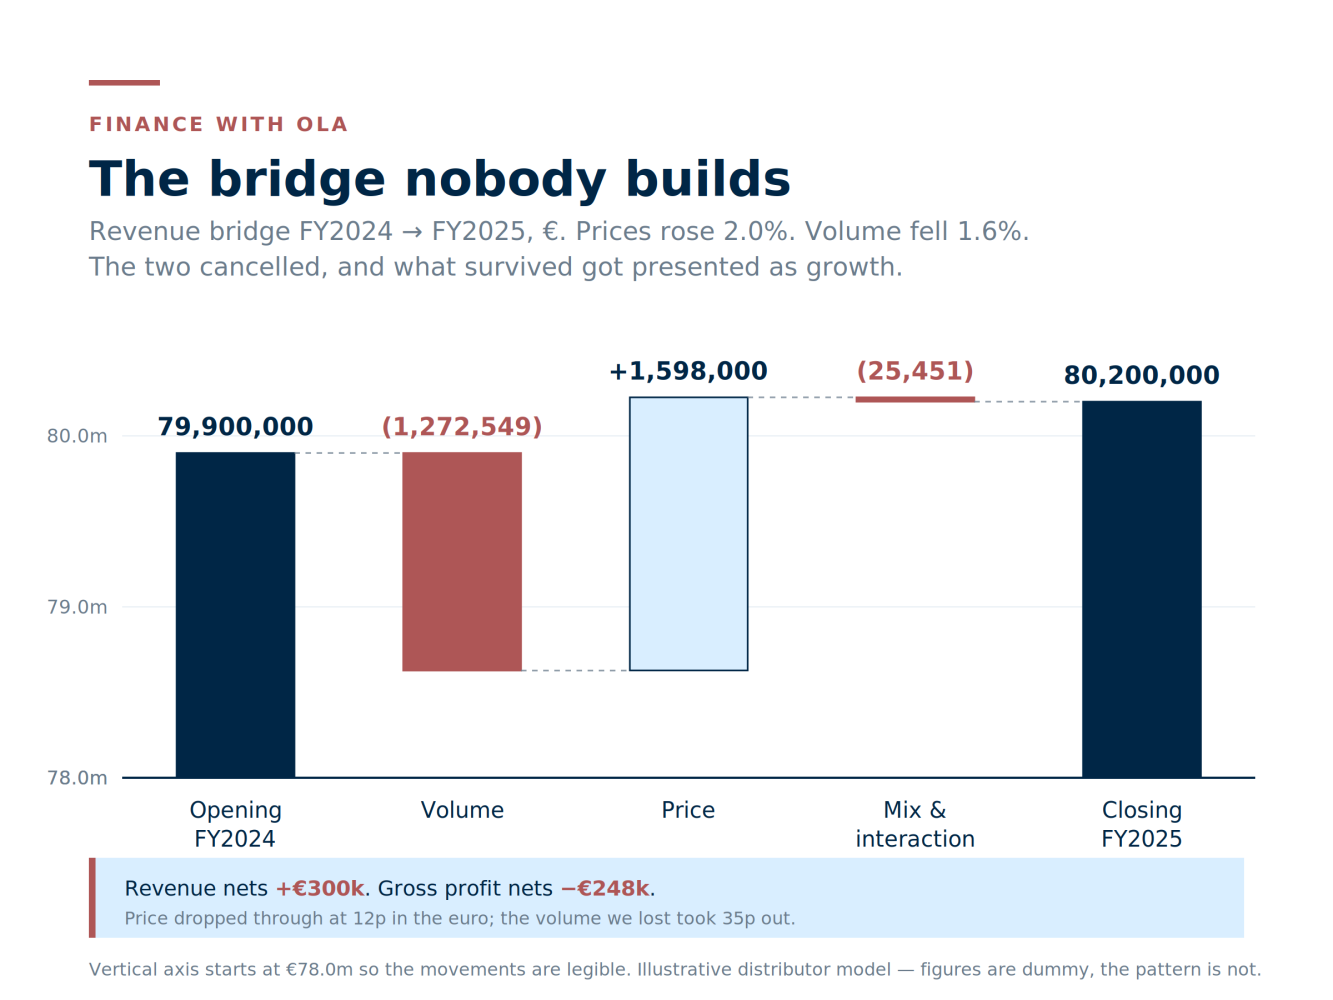
Prices went up 2%. Volume went down 1.6%. The two roughly cancelled, and what survived the collision was a €300k increase that got presented as growth, filed as growth, and rewarded as growth.
Gross profit that year fell €248k.
The bridge nobody builds
Here is the same year, decomposed:
Nothing here is hidden. Every number is available in the same system that produced the €80.2m. The bridge takes an afternoon to build the first time and twenty minutes every time after.
It doesn’t get built because the headline already answered the question the meeting asked.
The part that actually matters
Most people who do build the bridge stop here. Revenue split into its legs, presented, understood. Fine.
But a revenue bridge is only half a thought. The legs have to be converted into gross profit, because price and volume do not drop through at the same rate.
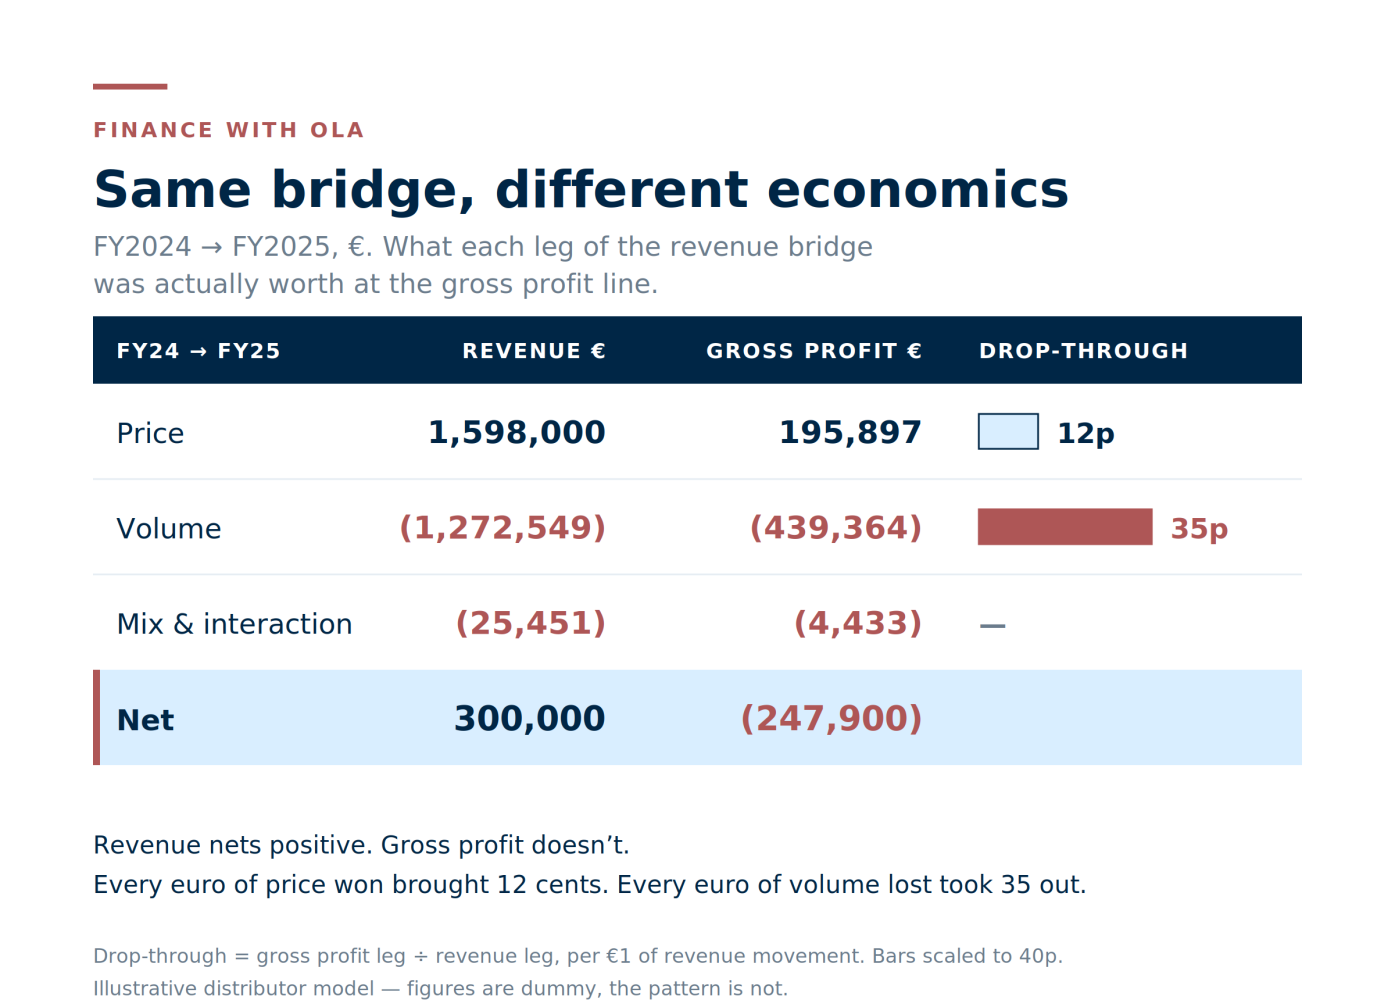
Every euro of price we won brought 12 cents of gross profit with it. Every euro of volume we lost took 35 cents out.
That is the whole story. Revenue nets to positive because the legs are similar in size. Gross profit nets to negative because the legs have completely different economics.
We passed cost inflation through to customers, which is what a 12% drop-through on price means - we recovered cost, we didn’t expand margin. And we lost volume that was carrying three times that rate.
Why the lost volume was expensive
The 35p figure is the interesting one, because the business-wide gross margin is 23.9%. If volume had declined evenly across the portfolio, the drop-through would be 24p. It was 35p.
So the volume didn’t leave evenly. It left from the top.
The categories that grew were the cheap ones - Bolts & Screws at 21.5% margin, Nuts & Washers at 19.6%, commodity hardware at 11.7%. The categories that shrank were the ones we actually make money on: Sealants & Chemicals at 33%, Tools & Consumables at 32%, Anchors & Fixings at 27%.
Aggregate volume decline is almost always a mix question in disguise. A 1.6% drop tells you nothing on its own. A 1.6% drop concentrated in your 33% margin lines is a different business.
Two years of the same thing
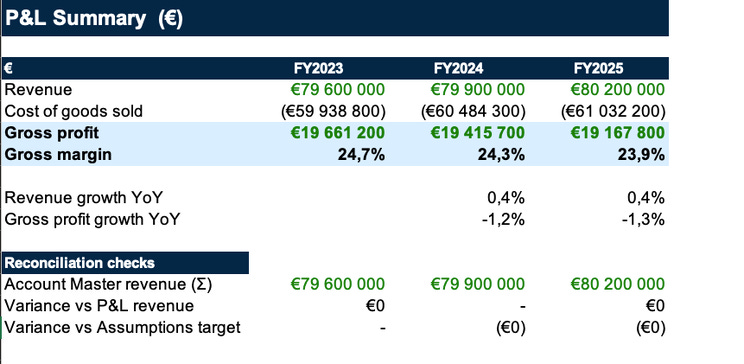
This wasn’t a one-year anomaly. Run the previous year and the shape is identical: revenue +€300k, gross profit −€246k.
Two years:
Revenue: +€600k
Gross profit: −€493k
Gross margin: 24.7% → 23.9%
Two consecutive years of reported growth, and the business is €493k worse off at the gross profit line than when it started. Both years were signed off. Neither year had a variance large enough to trigger a conversation, because the variance being measured was revenue.
What to put on the slide instead
Three changes, none of which require a system, a project, or a consultant.
1. Never show revenue growth without the price/volume split beside it. Same slide, not the appendix. If the split isn’t there, the number isn’t finished.
2. Convert both legs to gross profit before you present them. Revenue legs tell you what happened. Gross profit legs tell you whether it mattered. The drop-through rates are the argument - 12p versus 35p is a sentence anyone in the room can act on.
3. Ask which categories the volume left. Then ask whether those categories share a margin profile. If they do, you don’t have a volume problem - you have a mix problem that will keep compounding after the pricing lever is exhausted.
And the pricing lever does get exhausted. It’s currently doing all the work of holding the top line flat. There is a year, not far away, where price can’t cover the volume gap any more, and the revenue line finally shows what gross profit has been showing for two years.
The point of the bridge is to have that conversation before it’s a headline.